
VIP member

Online monitoring cloud platform for outdoor environmental pollution
Ausen's real-time monitoring cloud platform for dust and noise pollution is based on the construction of an air pollution grid monitoring system. The
Product details
Introduction to Osen Web Cloud Platform
Platform features
*Standard GISReal time map, supportingGISElectronic map status display, offline, online, and flashing alarm;GPS positioning and tracking
*Integrated data and video, convenient management, real-time monitoring screen output, video display; Equipped with pan tilt function for remote control of camera rotation and one click capture
*Equipment can be displayed and managed in different regions
*Meet the framework and functional requirements of government regulatory platforms
*Real time data viewing; View historical data change curve chart
*Comparison of real-time data and national control point data output on the same screen
*Real time data and status display of equipment
*Support hourly average, daily average, and monthly average
*Support year-on-year and month on month analysis of data
*Support ranking of various indicators
*Real time alarm page viewing, historical alarm record query,
*Support multiple remote startup linkage functions, including web pages, WeChat, and supporting software; The alarm threshold can be remotely configured.
*Statistics on excellent air quality
*Data export, statistical data in Excel spreadsheet format
*Support device management, device archives, after-sales and upgrade records
*Support user management and permission management
*Open relevant data interfaces as needed
*Support device access of over 5000 orders of magnitude
*Support OEM customized development, support customized interface
*Support multiple parameter monitoring, particulate matter(PM2.5/PM10/TSP)、 Noise, meteorological five parameters, negative oxygen ions, total radiation, light intensity, rainfall O2、H2S、NH3、SO2、NO2、、CO2、CO、O3、VOC、CH2OclassMonitoring data processing
*Automatic database backup and disaster recovery to ensure that data cases are not lost
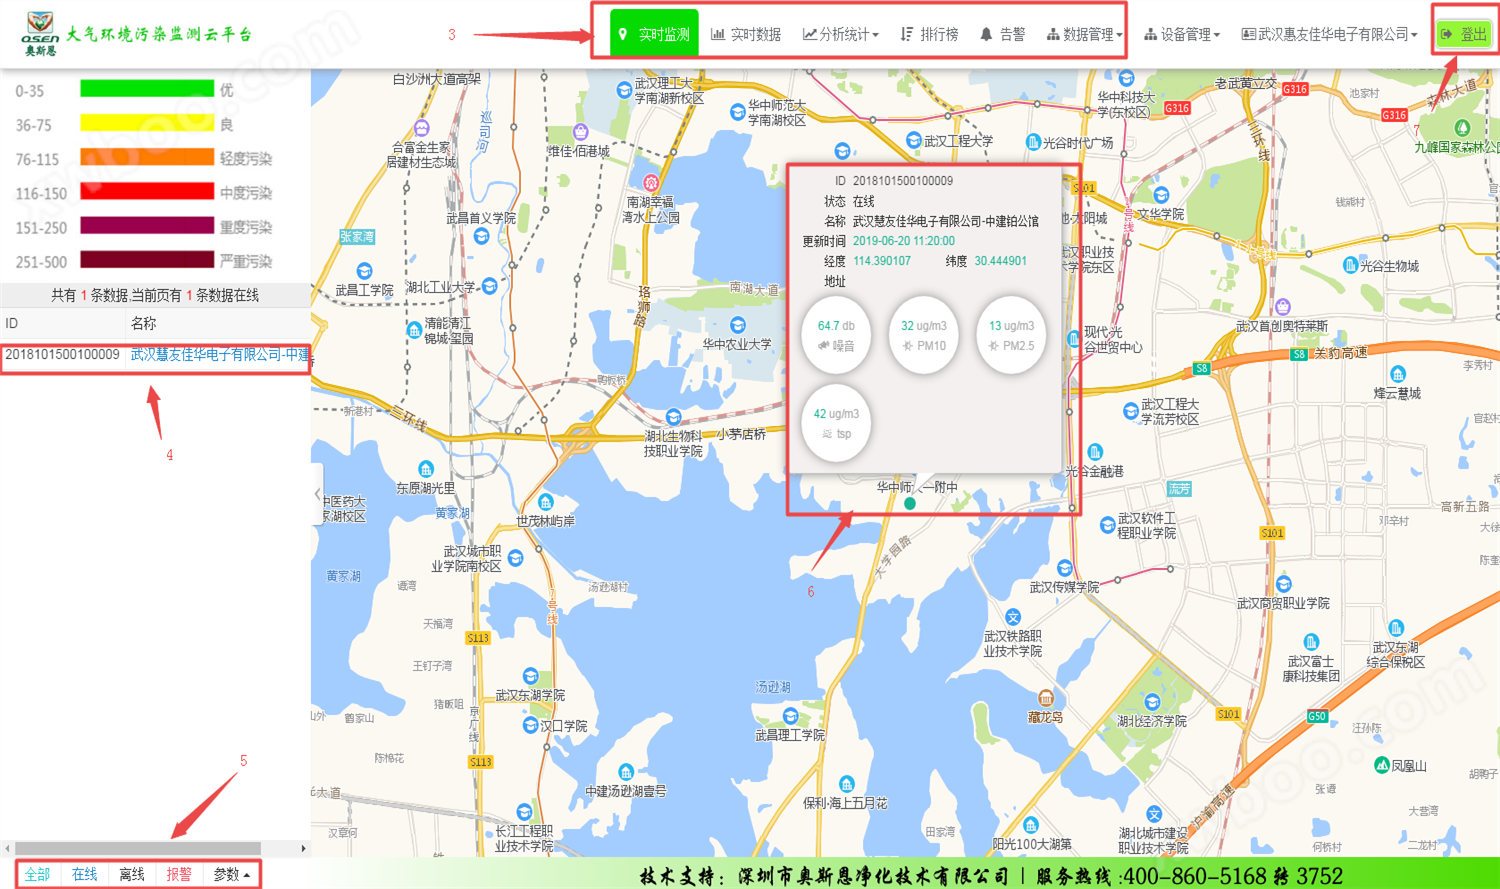
This function is an electronic map, Can display all devices separately, total, Online devices, Offline devices, equalThe device that triggers the alarm before, Display the current parameter value based on the selected parameter, Equipment location; When the device displays red offlineColor, Online display shows blue. The alarm device will have a flashing effect.

(Real time data display, clear and distinct classification by region, curve chart analysis, real-time data output comparison with national control points on the same screen, real-time video monitoring screen display, and also equipped with one click capture function, remote control of on-site camera swing)

Historical data queries can provide information for any time period Query and download historical data from any monitoring point, Including hourly mean Daily average Monthly average, Display in the form of lists and curves.
Equipped with year-on-year function, different years/Month on month comparison of data at the same time point with month on month functionality Different years/Monthly data comparison
List of items with monitoring parameters exceeding the standardReminder of "exceeding the upper limit of testing" jumping; Historical warning, select the device and time period, and query the history of exceeding the standard within that time period

The system provides the function of downloading historical data for all devices, parameters, and time periods, The default storage time for historical data on the platform is1 year.
We can also provide cloud platform page customization services

Online inquiry
-
Contacts
-
Company
-
Telephone
-
Email
-
WeChat
-
Verification Code
-
Message Content
-