
VIP member
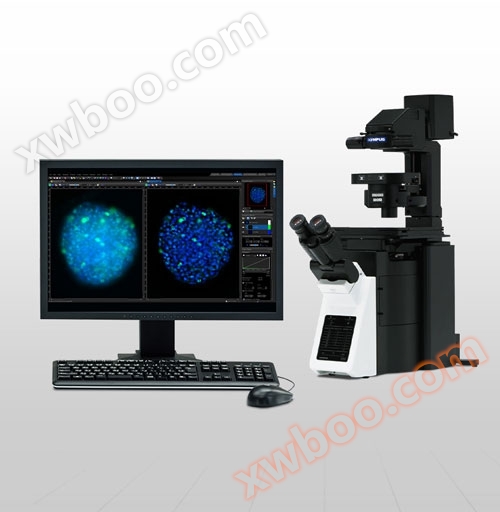
Imaging software cellSens
IntuitiveOperation. SamlessWorkflow. The Olympus cellSens platform creates a unique personalized and intuitive imaging experience based on operator pr
Product details
Intuitive Operation. Seamless Workflow.
The Olympus cellSens platform creates a unique personalized and intuitive imaging experience based on operator preference workflows. CellSens provides comprehensive control over the display and placement of icons, toolbars, and controls, simplifying the desktop and improving work efficiency.
CellSens is user-friendly, powerful, and flexible. The software is designed with modules that can be selected based on budget and imaging applications. This enables the software to continuously develop and meet research needs.
cellSens Entry
cellSens Entry is the ideal stepping stone for researchers wanting to move into digital image acquisition and documentation, providing all the tools needed for simple image acquisition.
cellSens Standard
Olympus cellSens Standard software is an advanced version of cellSens Entry, which can not only capture individual images, but also recognize/control themmicroscopeEncoding/electric components to achieve complex mapping processes (such as time series shooting/multi-color fluorescence mapping, etc.).
cellSens Dimension
Olympus cellSens Dimension is an all-in-one version of cellSens software, which controls the fully electric microscope system, combines and executes complex experimental processes as needed (long-term time-lapse/multi-layer z-stack/multi-color/multi-point/puzzle/autofocus, etc.), and has powerful image analysis and processing capabilities.

5D experiment acquisition
Professional 5D collection tools (XY/Z/multi-color/multi-point/time series), such as the combination of experimental administrator GEM and titration plate navigator WN (porous plate), are used to demonstrate the experimental collection process in a streamlined structural diagram, which is concise and clear.
-GEM (Graphic Experiment Manager): Use a graphical approach to visually combine the required image collection functions and easily implement complex experimental processes.
-WN: Well Navigator (Porous Plate): The mapping process is streamlined, and the images can be viewed in one-to-one correspondence with the pore positions on the porous plate, with a user-friendly interface

Image processing and sharing
The unique TruSight deconvolution function and various powerful image processing techniques enable flexible processing of images according to display or analysis needs. At the same time, combined with Conference Mode, it is easy to share experimental images, use built-in report templates, and drag and drop graphics and text to generate professional reports.

Powerful analytical tools
Extracting more data through dynamic image processing to obtain more reliable experimental results. The software's deep learning technology (TruAI) can also achieve even better segmentation and recognition. Use the macro manager to automatically complete the entire workflow, including image analysis and saving.

Customizable user interface
Using the custom function (My Function) tool, customize the software work interface according to personal habits, and freely combine the drawing and analysis tool windows.

cellSens Functions and Optional Solutions |
| Dimension | Standard | Entry | |||
|---|---|---|---|---|---|
| Layout | User experience customization | ✓ | ✓ | ✓ | |
| View | Overlay multiple images | ✓ | ✓ | - | |
| Document groups for side-by-side image comparison | ✓ | ✓ | ✓ | ||
| Movie playback | ✓ | ✓ | ✓ | ||
| Tile view (multiple images in a single data set shown side-by-side) | ✓ | ✓ | ✓ | ||
| Slice view for orthogonal plane viewing of 3D or time-lapse data sets | ✓ | - | - | ||
| Voxel viewer for isosurface and volumetric rendering of 3D and 4D data sets | ✓ | - | - | ||
| Image Acquisition | Snap/movie acquisition | ✓ | ✓ | ✓ | |
| Time-lapse at specified interval | ✓ | ✓ | - | ||
| Automated multiwavelength | ✓ | ✓ | - | ||
| Z-stack | ✓ | - | - | ||
| Multidimensional (XYZT and wavelength) | ✓ | - | - | ||
| Graphical Experiment Manager | ✓ | - | - | ||
| Manual panoramic imaging (Instant MIA and Manual MIA) | ✓ | Manual Process | Manual Process | ||
| Multiposition visitation and stage navigator | Multiposition | Multiposition | - | ||
| Automated panoramic imaging (auto MIA, requires motorized stage) | Multiposition | Multiposition | - | ||
| Instantly create EFI image (manual or motorized Z) | ✓ | Manual Process | Manual Process | ||
| Simultaneous multicolor Imaging (requires two identical cameras** or image splitter) | ✓ | - | - | ||
| Live deblurring | ✓ | - | - | ||
| High dynamic range imaging (HDRI) | ✓ | - | - | ||
| Multiwell plate acquisition | Well plate navigator and Multiposition | - | - | ||
| Image Processing | Geometry/combine/filter processing | ✓ | ✓ | - | |
| Fluorescence unmixing | ✓ | - | - | ||
| Brightfield unmixing | Count & Measure | - | - | ||
| Deblurring (No/Nearest Neighbor, Wiener Filter) | ✓ | - | - | ||
| Kymograph | ✓ | - | - | ||
| 2D deconvolution | ✓ | - | - | ||
| 3D deconvolution (constrained iterative deconvolution with GPU process) | CI Deconvolution | - | - | ||
| Image Analysis | Phase analysis | ✓ | - | - | |
| Object measurements and classification | Count & Measure | Count & Measure | - | ||
| Interactive 2D measurements | ✓ | ✓ | ✓* | ||
| Intensity plot over time/z | ✓ | - | - | ||
| Colocalization | ✓ | - | - | ||
| Object counting (manual) | ✓ | ✓ | - | ||
| Object tracking | Tracking and Count & Measure | - | - | ||
| Online ratio and kinetics | Ratio/FRET | - | - | ||
| Ratio analysis (offline) | ✓ | - | - | ||
| FRET analysis | Ratio/FRET or Life Science Analysis | - | - | ||
Online inquiry
-
Contacts
-
Company
-
Telephone
-
Email
-
WeChat
-
Verification Code
-
Message Content
-