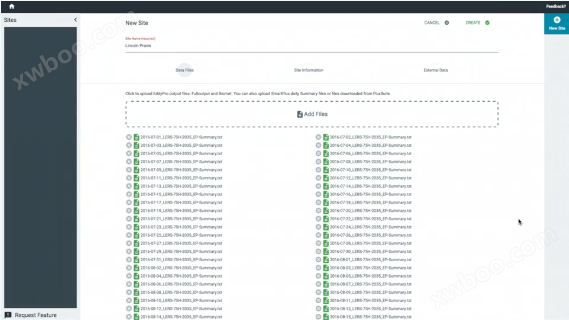
Tovi® Software is a graphical interface software for processing vorticity covariance data. Developed by LI-COR's professional technical team, using EddyPro's processing results as the data source, further achieving data interpolation QA/QC、 Calculate Footprints, drawings, and other operations. No programming required, the output results are exquisite and can be directly used for publishing papers.
Main function display
|
Automatic weather station data interpolation Occasionally, some meteorological data is lost in flux monitoring, so there is no need to worry. This software can view and select nearby weather stations (from)Or adoptAnd any data set from these meteorological stations can be used to interpolate the missing meteorological data in flux monitoring. |
 |
|
View the full picture of the data All data can be quickly viewed in the data graph. You can also view data statistics results, such as the percentage of valid data on a time series. It can also quickly identify areas on the time series that may require interpolation. |
 |
|
QA/QC You can choose any variable to filter flux data, or easily set minimum/maximum thresholds using sliding lines. By using a single software package, QA/QC can be improved without even writing any code. |
 |
|
Footprint modeling Unprecedented software features allow viewing of monitoring point maps and plotting of desired areas near observation towers in the footprint calculation function. Or by calculation, plot other areas that you want to include (or exclude). Even snapshots of footprint modeling can be saved for data display. |
 |
|
input/output Data can be input from EddyPro or SmartFlux. It can also output multiple data formats, including Excel CSV, JSON, MATLAB, NETCDF, and data formats compatible with online interpolation tools. |
 |
Learn more
| View video introduction | Apply for a 15 day free trial |

